
ChartHop for HR Analytics and Workforce Planning simplifies complex people data. See how this tool builds better teams. Visit today for a smarter approach.
Why ChartHop Is a Game-Changer in HR Analytics and Workforce Planning
Most HR teams are drowning in spreadsheets.
Data is scattered across five different systems.
Leadership asks for a headcount forecast, and it takes three days to pull the numbers.
This is not work. This is busywork.
The best companies don’t operate this way.
They use tools that turn static data into live, actionable intelligence.
ChartHop is the tool that kills the spreadsheet dependency.
It connects your data silos so you can actually see what is happening across your organisation in real time.
If you are serious about scaling your company, you need a single source of truth.
Stop guessing what your talent density looks like.
Stop manually updating organigrams every month.
Get the data, make the call, and move on to high-value projects.
- What is ChartHop?
- Key Features of ChartHop for HR Analytics and Workforce Planning
- Benefits of Using ChartHop for HR and Recruitment
- Pricing & Plans
- Hands-On Experience / Use Cases
- Who Should Use ChartHop?
- How to Make Money Using ChartHop
- Limitations and Considerations
- Final Thoughts
- Frequently Asked Questions
What is ChartHop?
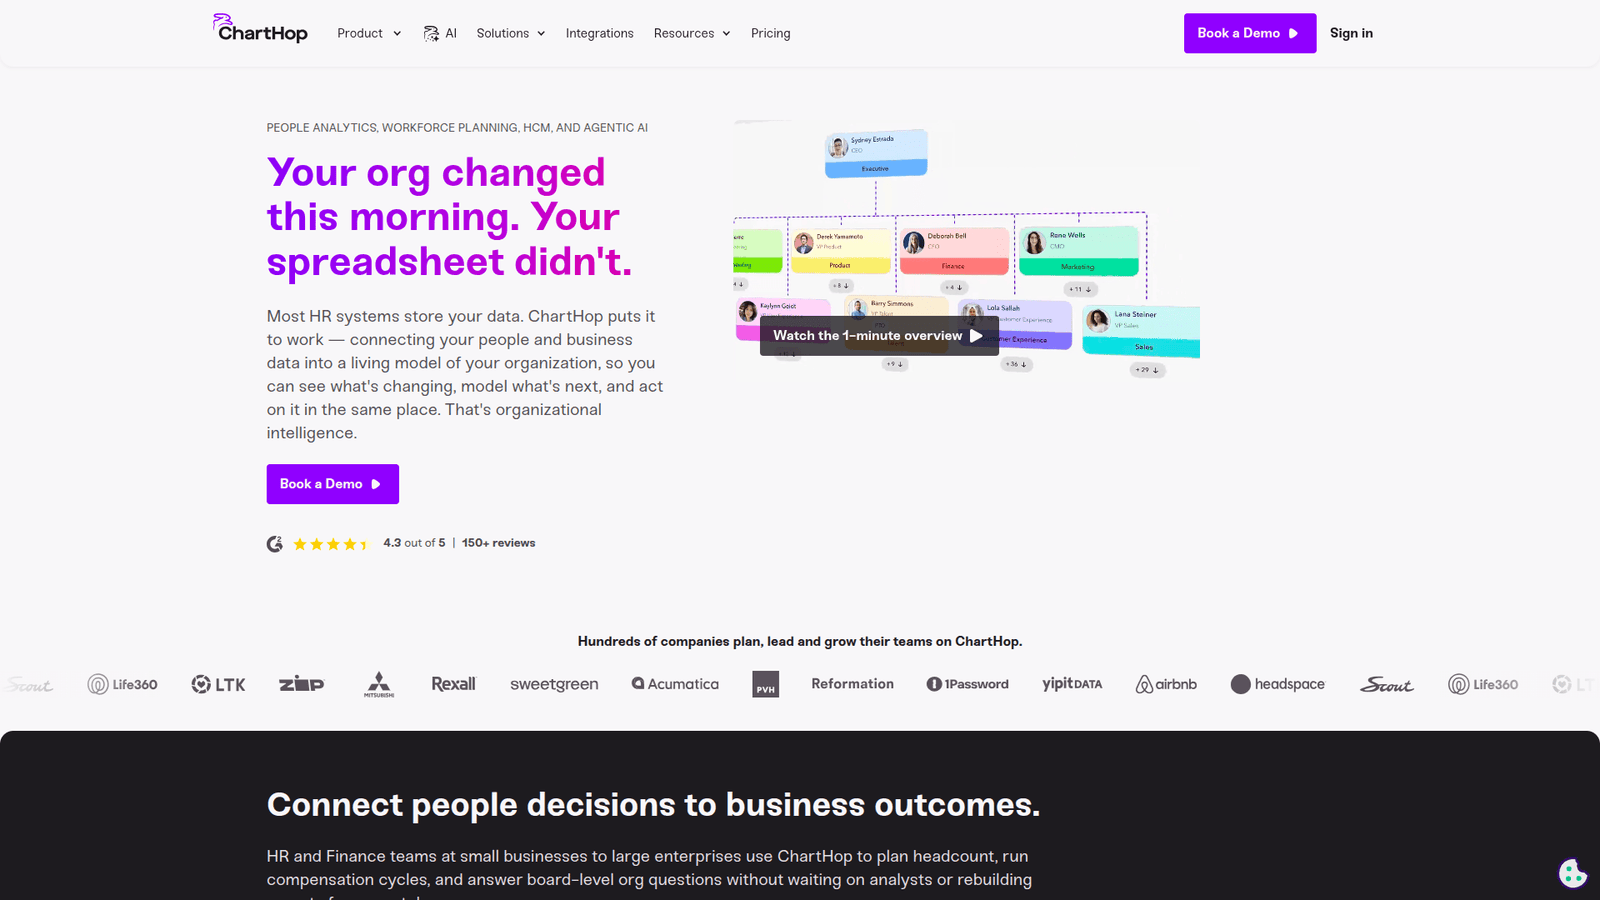
ChartHop is a people operations platform.
It pulls data from your ATS, HRIS, and payroll systems to create a unified view of your entire workforce.
It is not just an organigram tool.
It is a planning engine.
It allows you to model changes, compare scenarios, and track progress against hiring plans.
If you need to know how a shift in budget affects your hiring goals, ChartHop tells you in seconds.
This is built for leaders who hate waiting for reports.
It gives you the visibility to spot bottlenecks before they turn into major problems.
It stops the back-and-forth between HR and finance.
Key Features of ChartHop for HR Analytics and Workforce Planning
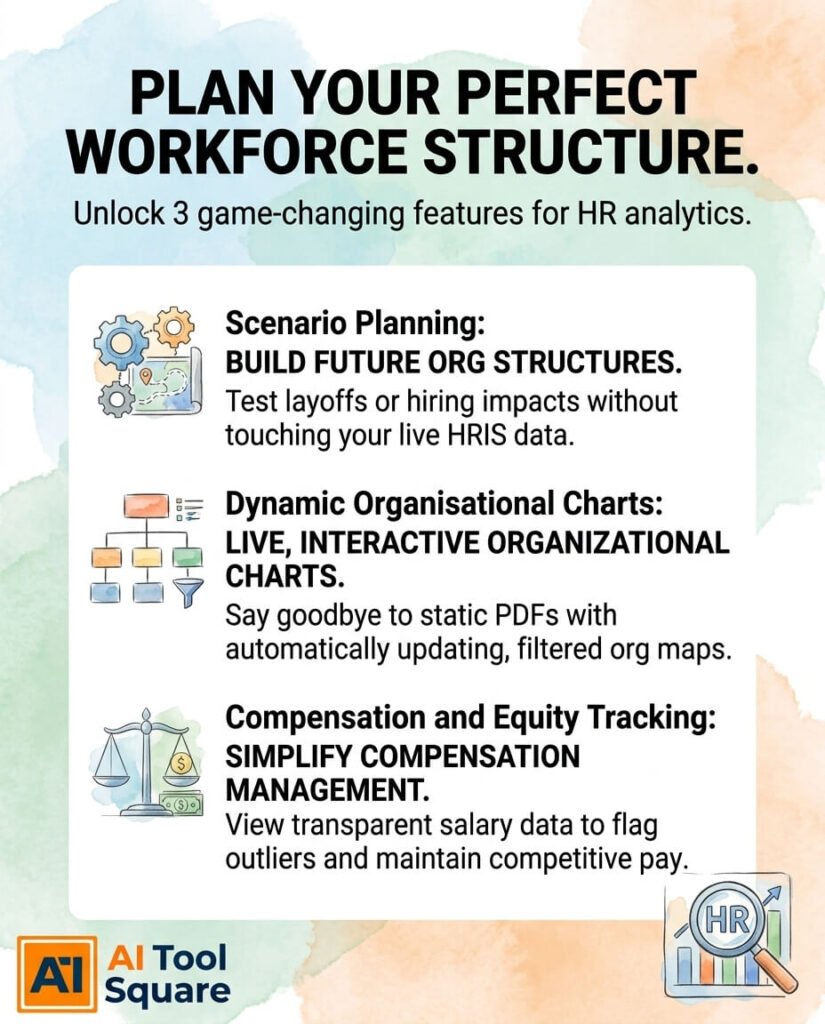
- Scenario Planning:
You can build multiple versions of your future org structure.
Test the impact of layoffs, new hires, or departmental restructuring without touching your live HRIS.
It shows you exactly what happens to your budget before you take action. - Dynamic Organisational Charts:
Static PDFs are dead.
ChartHop provides live, interactive org charts that update automatically.
You can filter by location, role, compensation, or any metric that matters to your strategy. - Compensation and Equity Tracking:
Managing pay bands is often a mess.
This tool provides a transparent view of compensation data.
It flags outliers and helps you keep your salary structures competitive without blowing the budget.
Benefits of Using ChartHop for HR and Recruitment
The primary benefit is speed.
When your data is synced, you stop being a data entry clerk.
You become a strategist.
Instead of spending hours formatting Excel cells, you spend time solving people problems.
Visibility is the second major win.
Most teams have blind spots.
You might not realise that one department has a 30% vacancy rate while another is over-hired.
ChartHop highlights these imbalances immediately.
Quality of decisions improves when you have the right numbers.
No more debating whose data is correct.
Since everything pulls from your official source, the conversation shifts to strategy.
The friction between departments disappears.
Pricing & Plans

ChartHop offers tiered pricing based on the size of the company and the specific features required.
There is no “one size fits all” price listed on the site.
Companies usually need to request a demo and provide their headcount numbers to get a quote.
The premium plans include deep integrations, custom reporting, and advanced security features.
While it is an investment, it replaces multiple other tools.
Look at the cost of the time saved by your team.
Usually, the platform pays for itself within the first quarter by reducing administrative drag.
Hands-On Experience / Use Cases
Consider a high-growth startup planning a Series C round.
The executive team needs to prove that their hiring plan is efficient.
They use ChartHop to model a 50-person expansion across engineering and sales.
The platform calculates the cost of those hires against the available budget.
It identifies that shifting the hiring focus to a cheaper region keeps them within their burn rate.
The team saves two weeks of manual analysis.
In another case, a medium-sized company manages a merger.
They use the platform to visualise two different company structures side-by-side.
They identify overlapping roles and create a plan for team integration.
The transition happens with significantly less drama because the plan is based on hard data rather than gut feeling.
Who Should Use ChartHop?

People Operations managers need this to track headcount and stay lean.
HR Directors use it to present data to the CEO.
Finance teams love it because it links people costs to actual budget line items.
Startups with over 50 employees should look at this tool.
Once a company grows past a certain size, spreadsheets become a liability.
Agencies that manage talent for clients can also use it to offer better workforce consultancy.
If your headcount changes monthly, you are the ideal user.
If you find yourself manually checking salaries against budget, you are overdue for this upgrade.
How to Make Money Using ChartHop
You can offer HR consultancy services.
Clients struggle to scale because they lack a plan.
Use ChartHop to build headcount models for them.
Charge a flat fee for setting up their org design and hiring strategy.
- Fractional HR Strategy:
Work with multiple clients as a part-time HR lead.
Use the tool to manage their org health and growth.
You finish the work in half the time of other consultants, meaning you can handle more clients. - Compensation Benchmarking Services:
Help clients fix their salary bands.
Use the data visualization features to show them where they are overpaying or underpaying.
This value is easy to sell because it directly impacts their bottom line. - Operational Audit Projects:
Offer a “clean up” service.
Many companies have a mess of HR data.
Connect their systems to ChartHop, clean the data, and provide a roadmap for improvement.
Companies pay high rates for clarity and order.
Limitations and Considerations
The platform requires clean data to function well.
If your ATS or payroll data is messy, the output will be messy.
You must do the groundwork of organising your base systems before the tool becomes a magic wand.
There is a learning curve.
It is a powerful piece of software, not a simple app.
It takes time for the team to learn how to build complex scenarios.
Plan for a setup phase of a few weeks where you get your integrations sorted.
Final Thoughts
Stop doing manual work.
If you want to move up, you need to provide answers, not just data.
ChartHop provides the answers.
It takes the guesswork out of planning and gives you the confidence to execute.
Start by auditing your current data flow.
If you see holes, plug them with this system.
Scale your operations with precision rather than luck.
ChartHop is the tool you need for modern HR Analytics and Workforce Planning.
Visit the official ChartHop website
Frequently Asked Questions
1. What is ChartHop used for?
It is used to manage people data, plan headcount, visualise organisational structures, and manage compensation across a growing business.
2. Is ChartHop free?
No, there is no free plan. It is a professional tool with tiered pricing tailored to the size and needs of the organisation.
3. How does ChartHop compare to other AI tools?
Most tools just process text. ChartHop connects to your actual HR systems to provide structured, data-backed insights specifically for workforce strategy.
4. Can beginners use ChartHop?
It is user-friendly, but it is designed for professionals. Expect a short period of learning to master the scenario planning and reporting features.
5. Does the content created by ChartHop meet quality and optimization standards?
Yes. The reports and visualizations are professional, accurate, and ready for use in board meetings and executive reviews.
6. Can I make money with ChartHop?
Yes. You can use it as a consultant to provide value to clients who struggle with headcount planning and organisational design.
7. How to make money with ChartHop?
Sell fractional HR services, conduct compensation audits, or provide headcount forecasting reports to businesses that need to scale efficiently.